Reporting Dashboard
Review summary reports on end-user activity for your Cloud Secure Edge organization
- Updated on
Overview
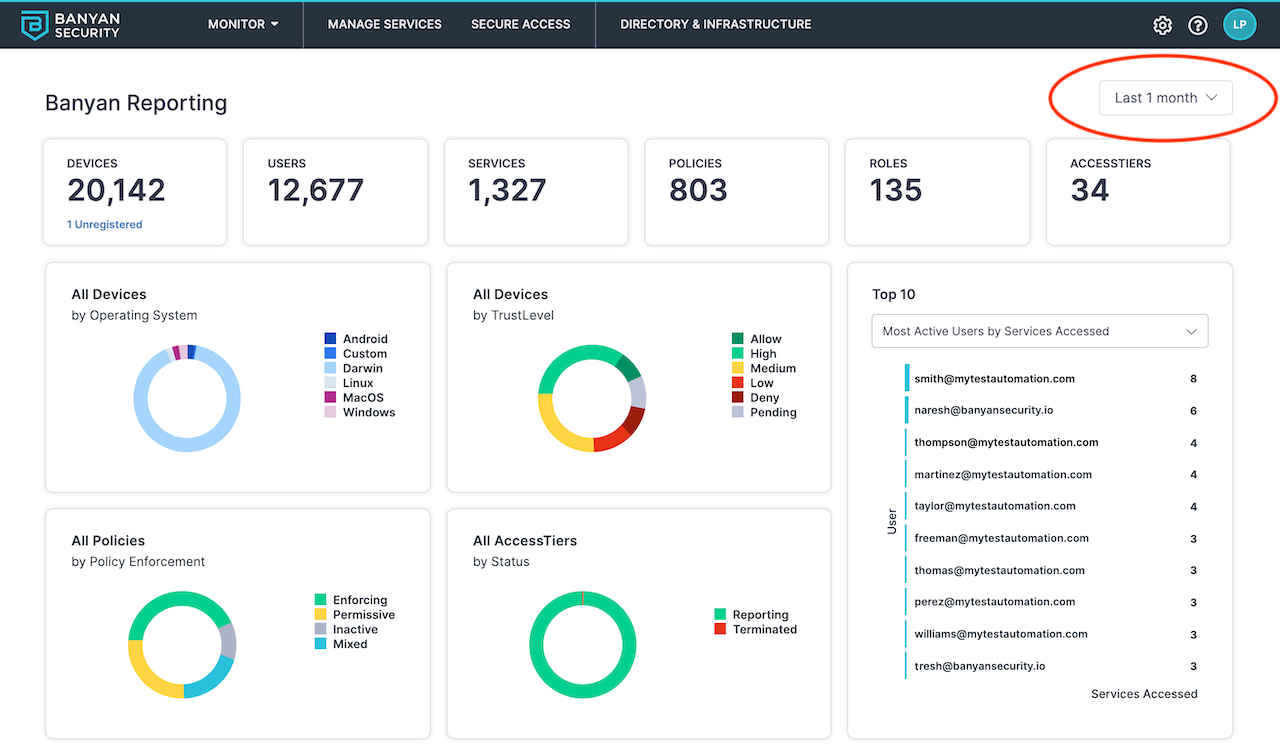
The Reporting Dashboard provides high-level visualizations of event data related to your organization, including:
- Access activity - Total counts and breakdowns of your devices, users, services, policies, roles, and Access Tiers.
- Access patterns - Most popular services by user, most active users by service, and more.
- TrustScore intelligence - Path of Zero Trust access from device (operating system) through Trust Level to service.
Using the Dashboard
Date Picker
Use the date picker to review specific timelines (Last Day, Last Week, Last 30 Days, etc.).
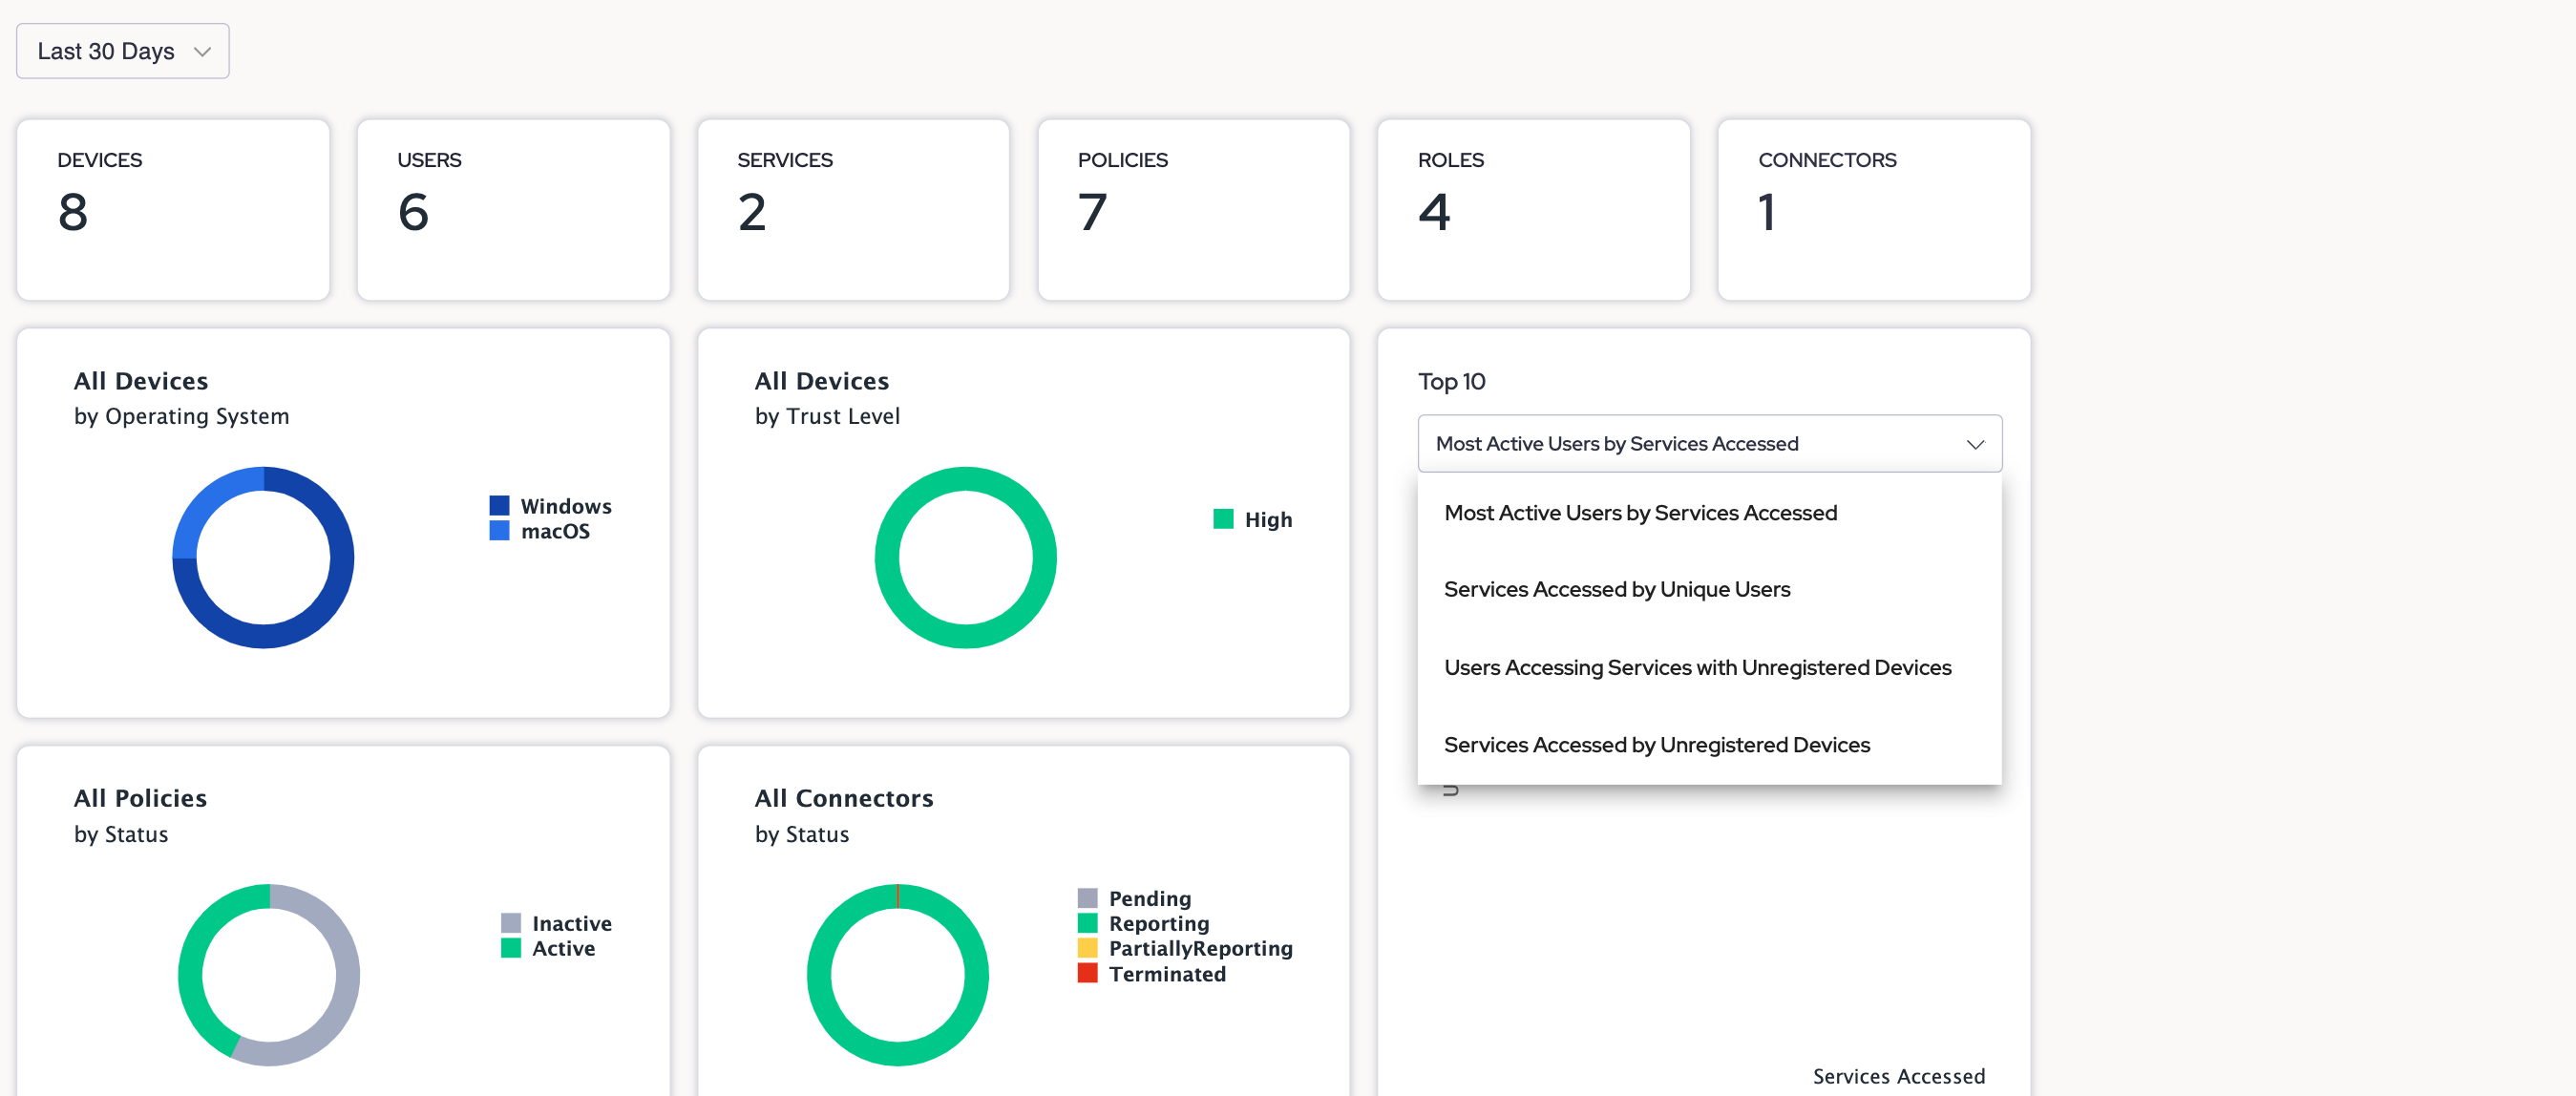
Top 10
The Top 10 list displays the most active access patterns related to your organization, such as:
- Services Accessed by Unique Users
- Most Active Users by Services Accessed
- Services Accessed by Unregistered Devices*
- Users Accessing Services with Unregistered Devices*
These Top 10 lists will only displayed if your organization has enabled Unregistered Devices.
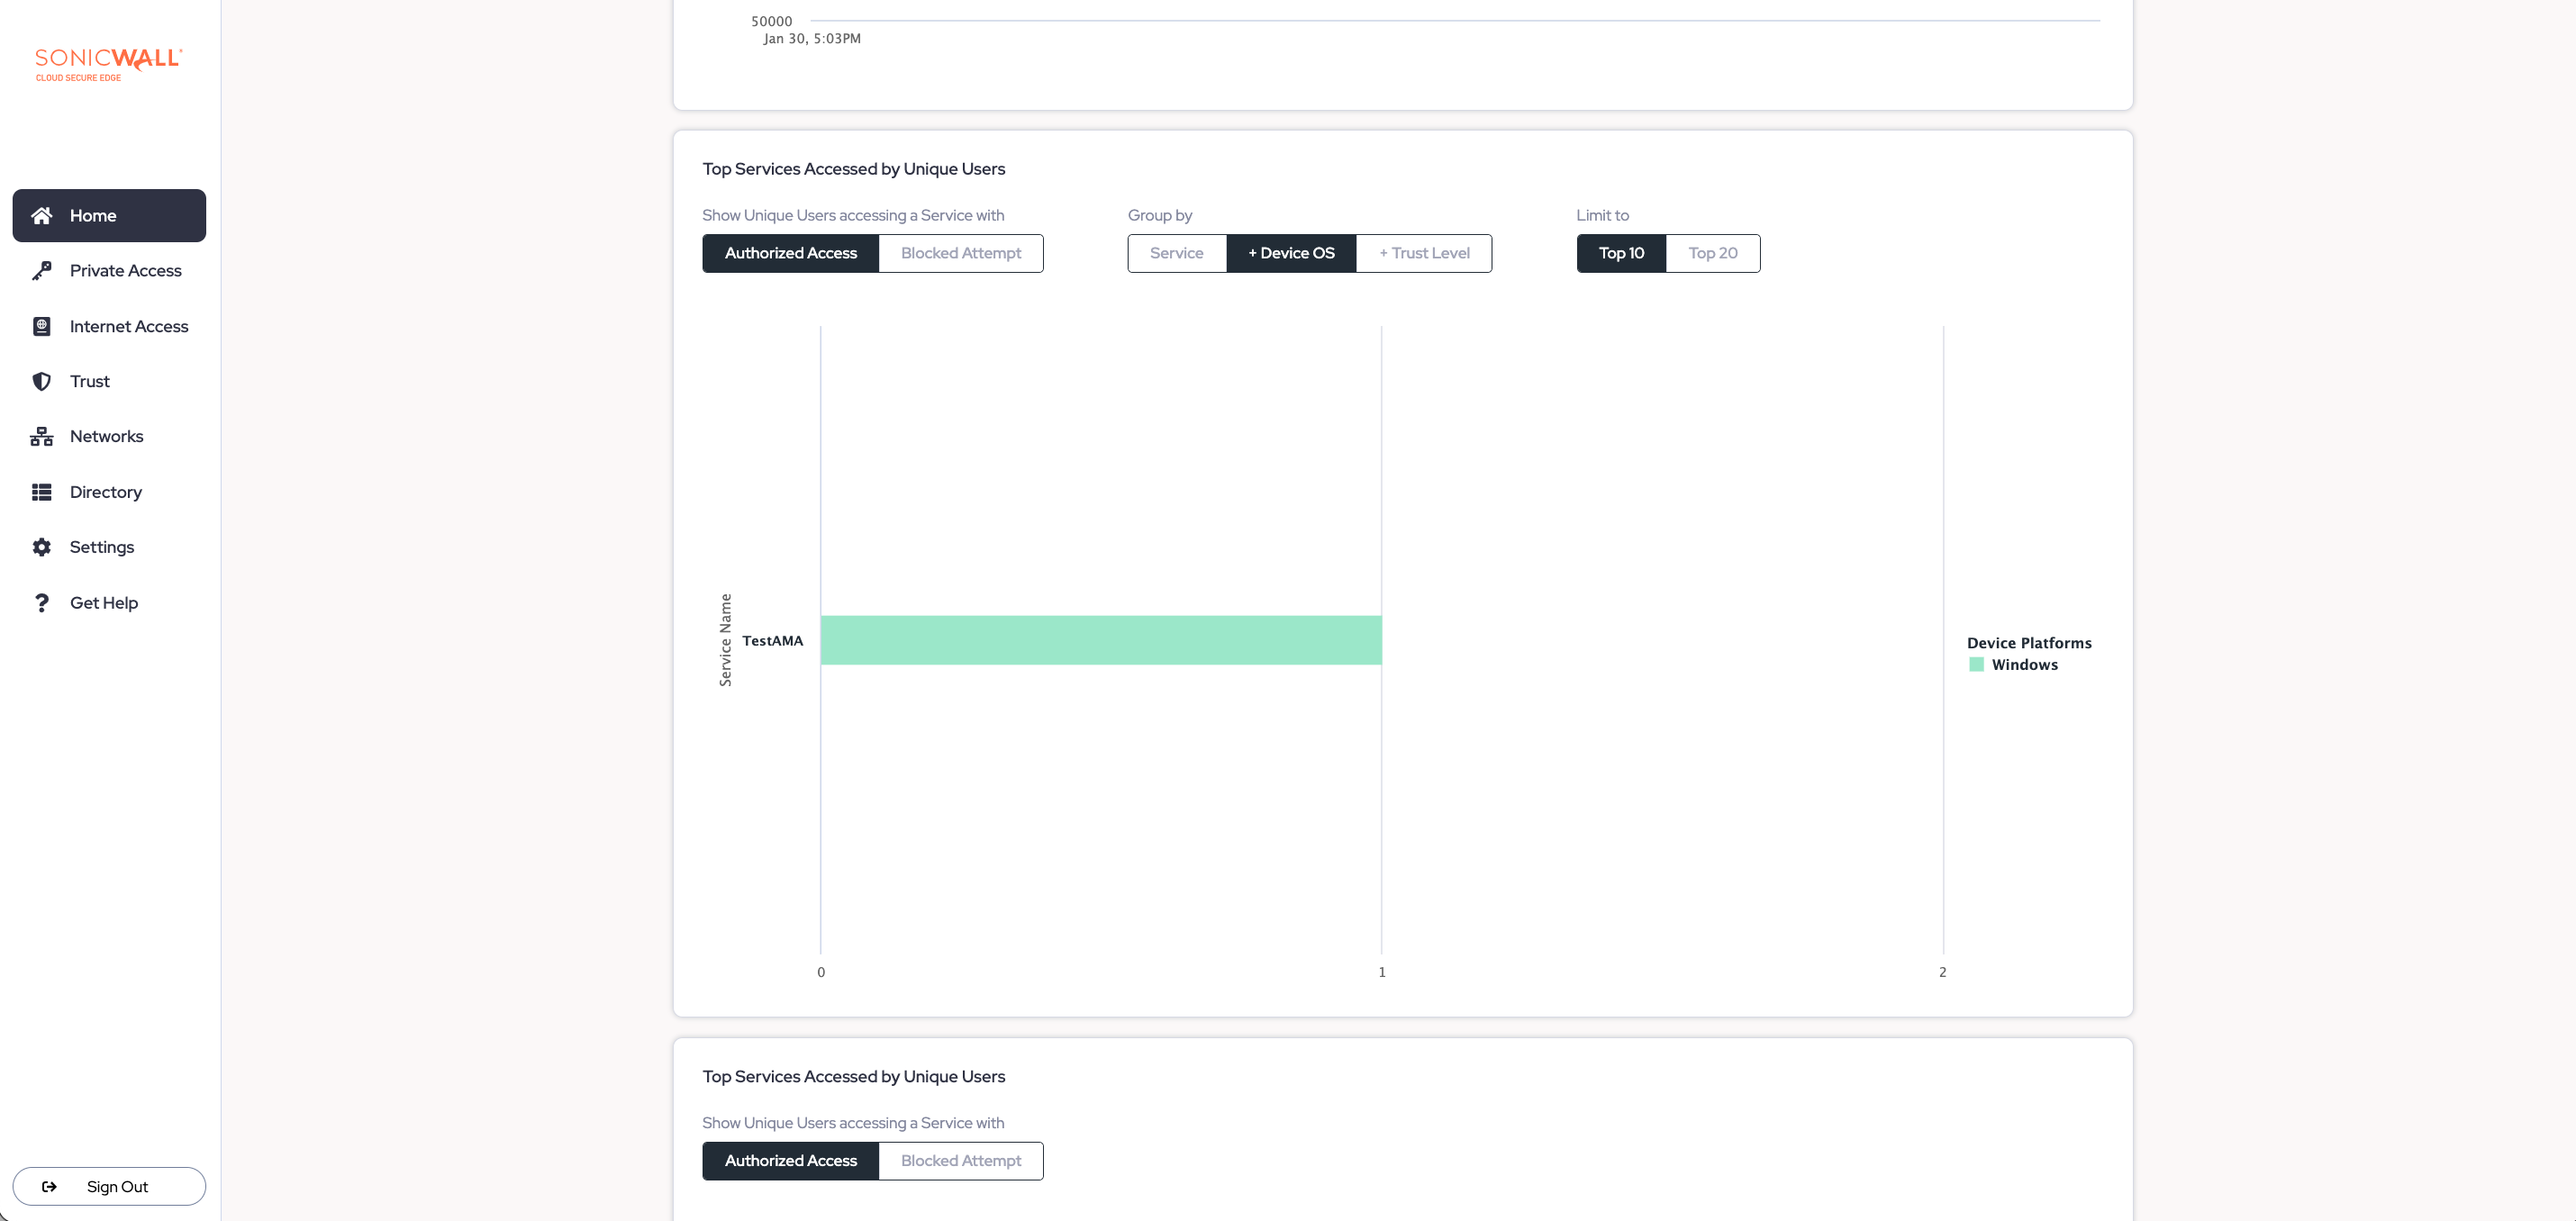
Top Services Accessed by Unique Users
The Top Services Accessed by Unique Users graph displays counts of unique users making authorized and blocked access attempts to individual services. Then, drill down deeper into the data by Device Operating System and TrustLevel.
Use this information to adjust roles and update policies. For example, if there is an alarming number of Unknown devices accessing a sensitive service, tighten the policy restrictions to block Unknown devices.
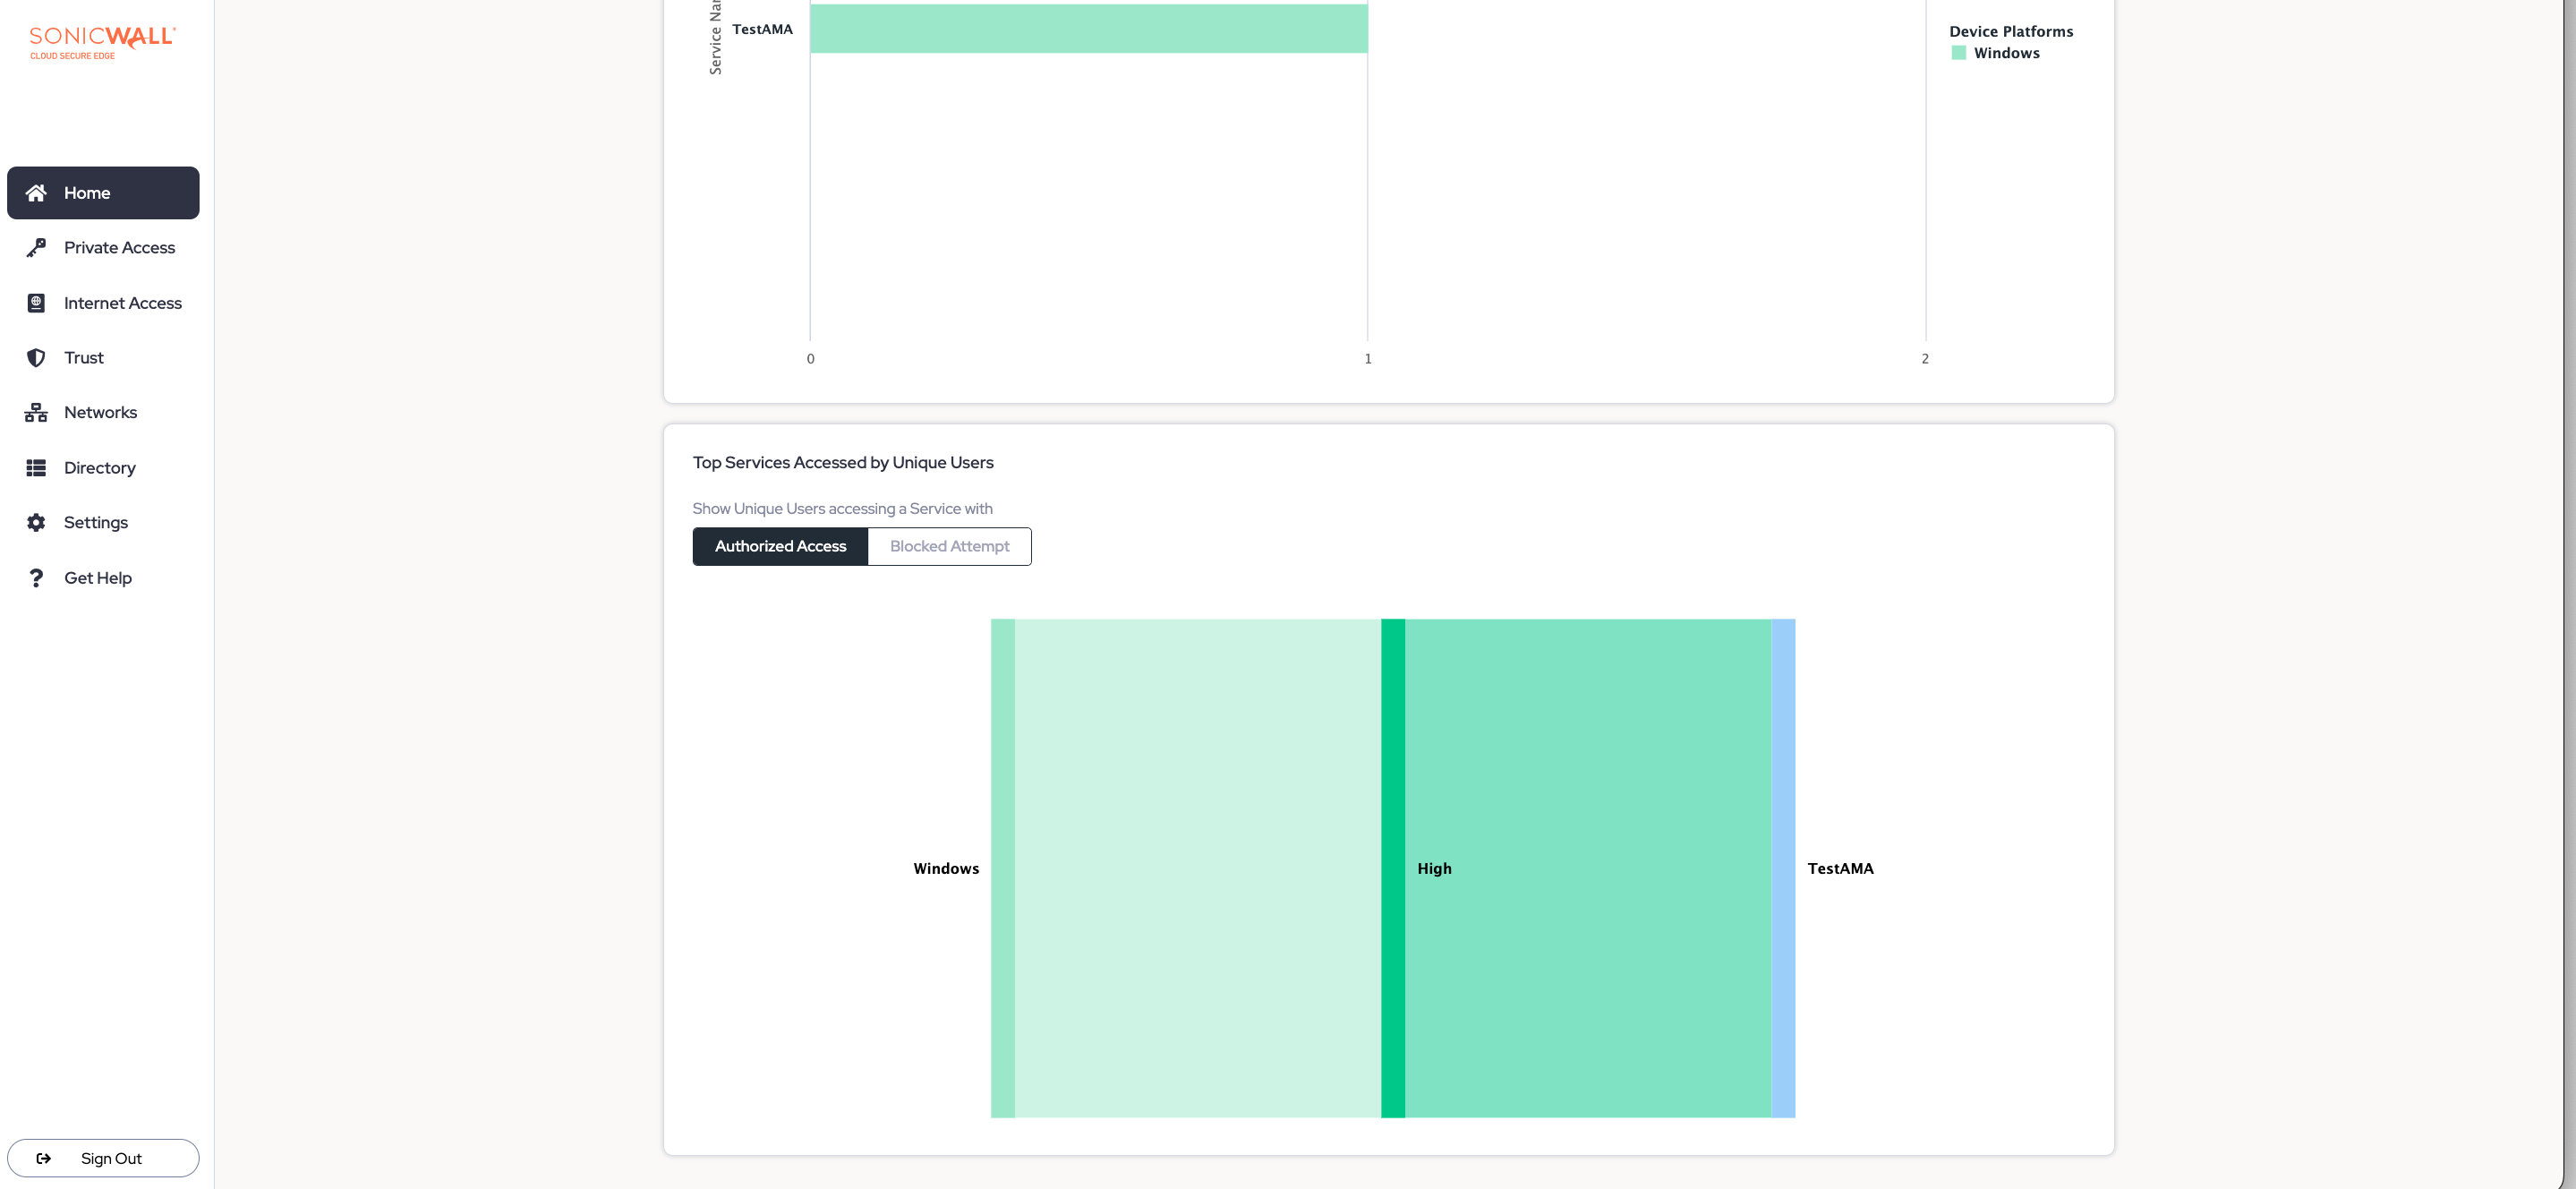
Devices by Trust Level Accessing Top Services
The Devices by TrustLevel Accessing Top Services graph displays a breakdown of unique users making authorized and blocked access attempts to individual services.
Use this information to adjust the strictness of your organization’s Trust Factors.