Monitoring Netagent
Aggregate and summarize networking metrics for the Access Tier
- Last validated: May 19, 2026
Overview
The Netagent binary, which is the core component of the Access Tier, is instrumented to generate metrics to be collected by a StatsD daemon; the daemon will then generate aggregates and relay them to a monitoring backend.
Enabling metrics collection
To enable metrics collection, enter the Metrics Collection Address under the Advanced Settings tab in the Access Tier configuration spec.
Once configured, the following metrics will be sent to the statsd daemon:
| Metric Name | Metric Type | Description |
|---|---|---|
banyan.transmit_rate |
COUNT | Bytes transmitted |
banyan.receive_rate |
COUNT | Bytes received |
banyan.connections |
COUNT | Number of TCP connections |
banyan.errors |
COUNT | Number of failures to connect to the upstream server |
banyan.unauthorized_attempts |
COUNT | Number of attempted accesses blocked by policy |
banyan.response_time |
HISTOGRAM | Time to respond to a HTTP request |
banyan.decision_time |
HISTOGRAM | Time to process a TCP request |
banyan.clients |
COUNT | Number of active clients connected to a Service Tunnel |
Netagent aggregates TX/RX byte counts and sends them to statsd daemon roughly every 13 seconds. For all metrics except TX/RX byte counts, Netagent sends statsd messages to the daemon immediately, where they are received and aggregated.
Every metric is tagged with descriptors that allow you to disaggregate telemetry data as needed:
| Tag Name | Tag Value |
|---|---|
site_name |
Name of Access Tier that generated the metrics |
host_name |
Linux host running Netagent, representing a specific instance of the Access Tier |
service_id |
ID of the CSE (formerly Banyan) Service for the metric |
Metric tags and the HISTOGRAM metric type are supported explicitly by Datadog, but may not work with other monitoring tools. The Response Time metric is calculated only for Hosted Website services.
Datadog Integration using DogStatsD
DogStatsD is a metrics aggregation service bundled with the Datadog Agent. When you run the Datadog agent alongside Netagent on the Access Tier machines, you can use DogStatsD to collect network metrics for visualization in your Datadog dashboards.
Leveraging Tags for per Service or per Access Tier metrics
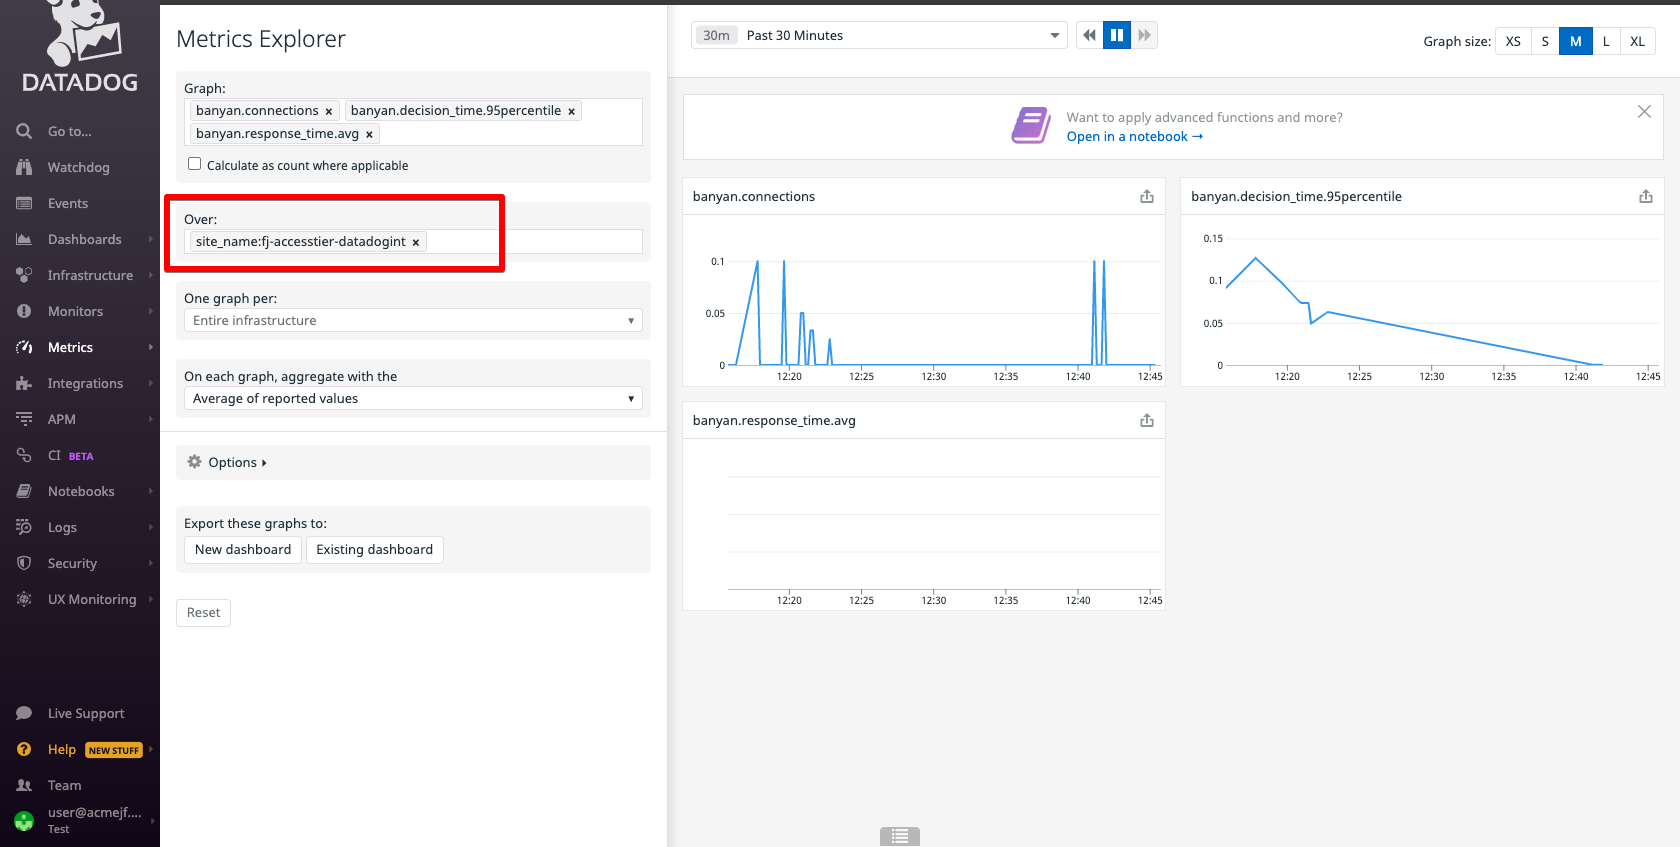
Metrics sent to Datadog contain tags that allow filtering at per Service or per Access Tier level. In order to filter metrics at an Access Tier level, navigate to the Metrics Explorer and filter on site_name={Access Tier}.
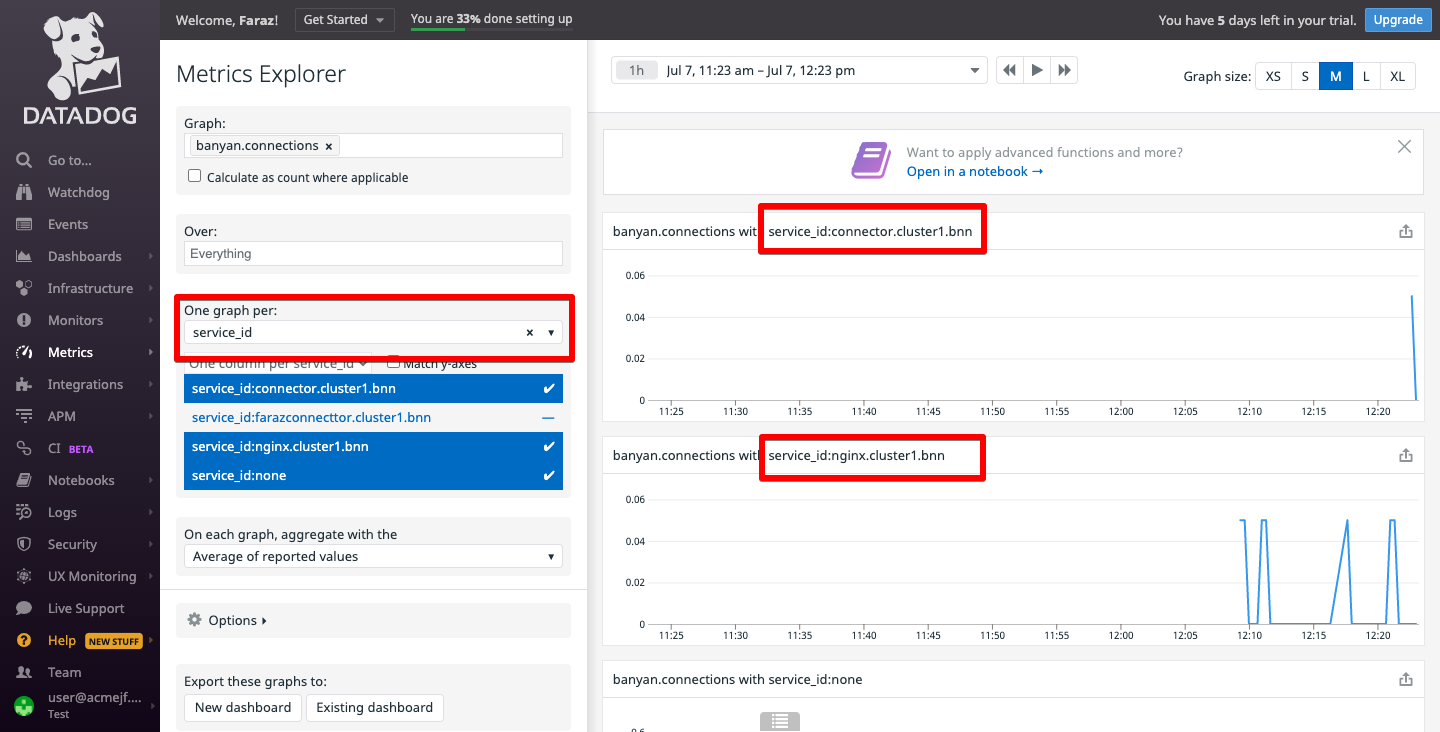
In order to filter metrics at a CSE service level, navigate to the Metrics Explorer and filter on service_id={Service Name}.