Key Capabilities and Features of the Access Tier
- Updated on
The Access Tier is an identity-aware cloud-managed proxy written in Golang, and it runs on Linux servers. Access Tiers are deployed similarly to open-source proxies (such as Nginx) but have the advantage of being built with zero-trust security functionalities.
Access Tier Architecture
The internal modules that comprise Access Tiers are depicted in the diagram below:
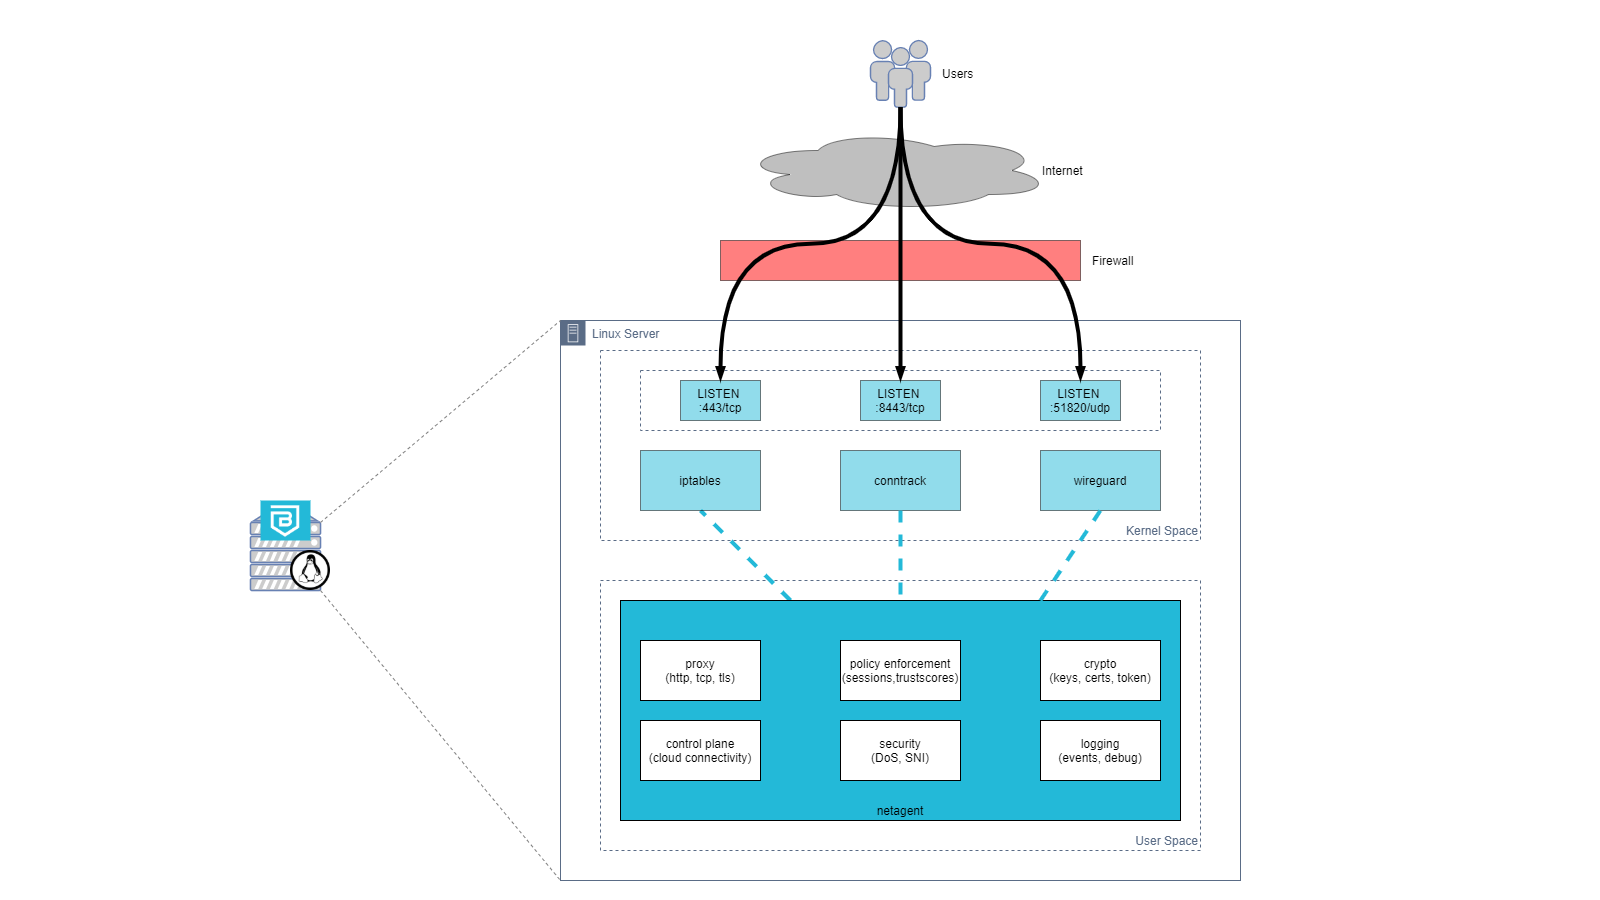
Access Tiers function primarily as a reverse proxy, intercepting traffic on specified ports on a Linux server. By default, Access Tiers intercept traffic on the following ports:
- 443/tcp - for web services, accessed via a browser
- 8443/tcp - for infrastructure services, accessed via the desktop app
- 51820/udp - for Service Tunnels that enable network access
Access Tiers leverage various Linux kernel functionalities to manage and forward traffic, including the following:
- iptables
- conntrack
- WireGuard
Supported Operating Systems
Netagent is the core technical component of an Access Tier. The Netagent binary can be installed on virtual or physical 64-bit Linux servers.
Officially Supported: the following distros are supported, when run with an officially released kernel:
- Amazon-Linux (2011.09-2018.03) and Amazon-Linux-2
- CentOS 7.x and RHEL 7.x
- Ubuntu 20.04+
Support Deprecated: the following Linux distros are no longer supported:
- CentOS 6.x
- Ubuntu 12.04, 14.04
Access Tier features
Health Check, logs, metrics
Overview
The Netagent provides a health check endpoint that provides a real time indicator for the status of the Netagent (up or down) and preliminary stats that can be used to evaluate the performance of the Netagent.
The Netagent provides the health check on port 9998 and the data presented from the health endpoint refreshes every 10 seconds.
Determining Netagent Health Status
Determining if the Netagent can service traffic to support the end users requests is critical for daily operations. To assist Loadbalancers in making the decision, the Netagent returns a 200 when it is available on port 9998. When the Netagent determines it is not healthy, the entire service will crash thus not returning anything on port 9998.
Stats provided by the Netagent Health Status
The Netagent has a health endpoint, /health, where it returns information about the services it provides and some critical information about the container or OS that the netagent is running on.
Here is an example output from the /health endpoint:
{
  "netagent": {
    "status": "up",
    "timestamp": "2023-07-18T01:28:45.080950798Z",
    "info": {
      "hostname": "tunnel-579fcb68-3a9d-4d7f-bc12-a6233e108e0b",
      "version": "2.7.1-39_gc907b778458",
      "start_time": "2023-07-18 01:27:40.961620437 +0000 UTC m=+0.041945553",
      "uptime": "1m4.119308781s"
    }
  },
  "shield_connection": {
    "status": "up",
    "timestamp": "2023-07-18T01:28:45.080952615Z",
    "info": {
      "seconds_since_status_change": 57.462623696,
      "seconds_since_rx": 45.666838646,
      "seconds_since_tx": 20.588735957
    }
  },
  "service_tunnels": {
    "status": "up",
    "timestamp": "2023-07-18T01:28:45.081091759Z",
    "info": null
  },
  "hosted_services": {
    "status": "up",
    "timestamp": "2023-07-18T01:28:45.081092718Z",
    "info": null
  },
  "system_resources": {
    "status": "up",
    "timestamp": "2023-07-18T01:28:45.081119661Z",
    "info": {
      "disk_used_percent": 40.484639586189786,
      "disk_inodes_used_percent": 4.942452566964286
    }
  }
}
When configuring a loadbalancer to check for the health of the Netagent we recommend an HTTP connection with return of 200.
Logs and Metrics
Operations teams can use Netagent’s built-in logs and metrics capabilities to set up high-availability configurations and detailed monitoring.
- Logs - Netagent saves logs to both console and file; you can manage the log level via the Netagent Configuration. To change the location (default:
/var/log/banyan/netagent.log), set the environment variableLOGFILENAME. You can also similarly configuresyslogdaemon to gather Netagent logs. - Metrics - Netagent uses the statsd format to aggregate and summarize its metrics. Once you set the Netagent Configuration to emit to your
statsddaemon, you can start collecting Netagent metrics including: tx/rx bytes, http response code, http response time, unauthorized attempts, error counts, etc. Metrics are emitted per service id.