Service Tunnel Access Logs
How to access Service Tunnel logs
Note: Currently, this feature is disabled by default. Please work with SonicWall to enable this feature.
Service Tunnel Access Logs Overview
Service Tunnel Access Logs provide admins with a clear record of all the access events a user would have through a Service Tunnel. Access events are determined as any FQDN (fully-qualified domain name) or IP an end user attempts to route to through Service Tunnel. The source IP and source port are reflected properly, even if source NAT is enabled.
Each access event is recorded on Netagent’s disk and contains the following information:
{“protocol”: “tcp”,
  “email”: “sam@banyansecurity.io”,
  “device_serial_number”: “J4H3C62G4T”,
  “service_tunnel_id”: “5a8eb945-472d-4a4c-978f-6baa0d6bcce1",
  “source_ip”: “10.167.0.2",
  “source_port”: 61007,
  “destination_ip”: “10.128.0.37”,
  “destination_port”: 22,
  “timestamp”: 1674258163559875300,
  “accesstier_name”: “xyz-service-discovery-test”}
Log size and log rollover adhere to Netagent’s advanced settings.
How to collect access logs
Note: This must be performed on each Netagent.
Step 1: Enable access logs
Contact a SonicWall representative to access Service Tunnel logs.
Step 2: Restart Netagent
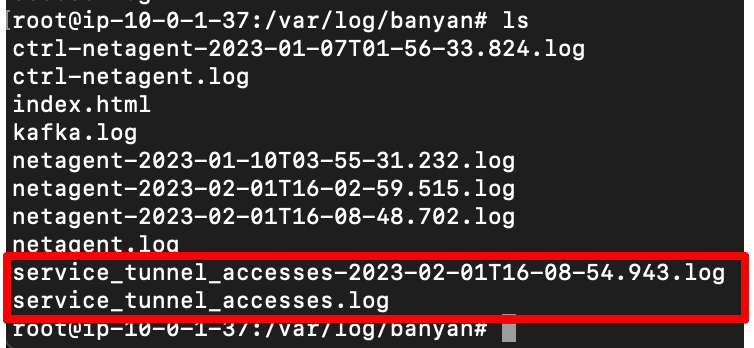
Step 3: On Netagent, go to the folder, /var/log/banyan/.
Step 4: View logs
