Access Tier Troubleshooting
Common issues and best practices to troubleshoot your Access Tier deployments
- Updated on
User -> Access Tier -> Backend Connectivity
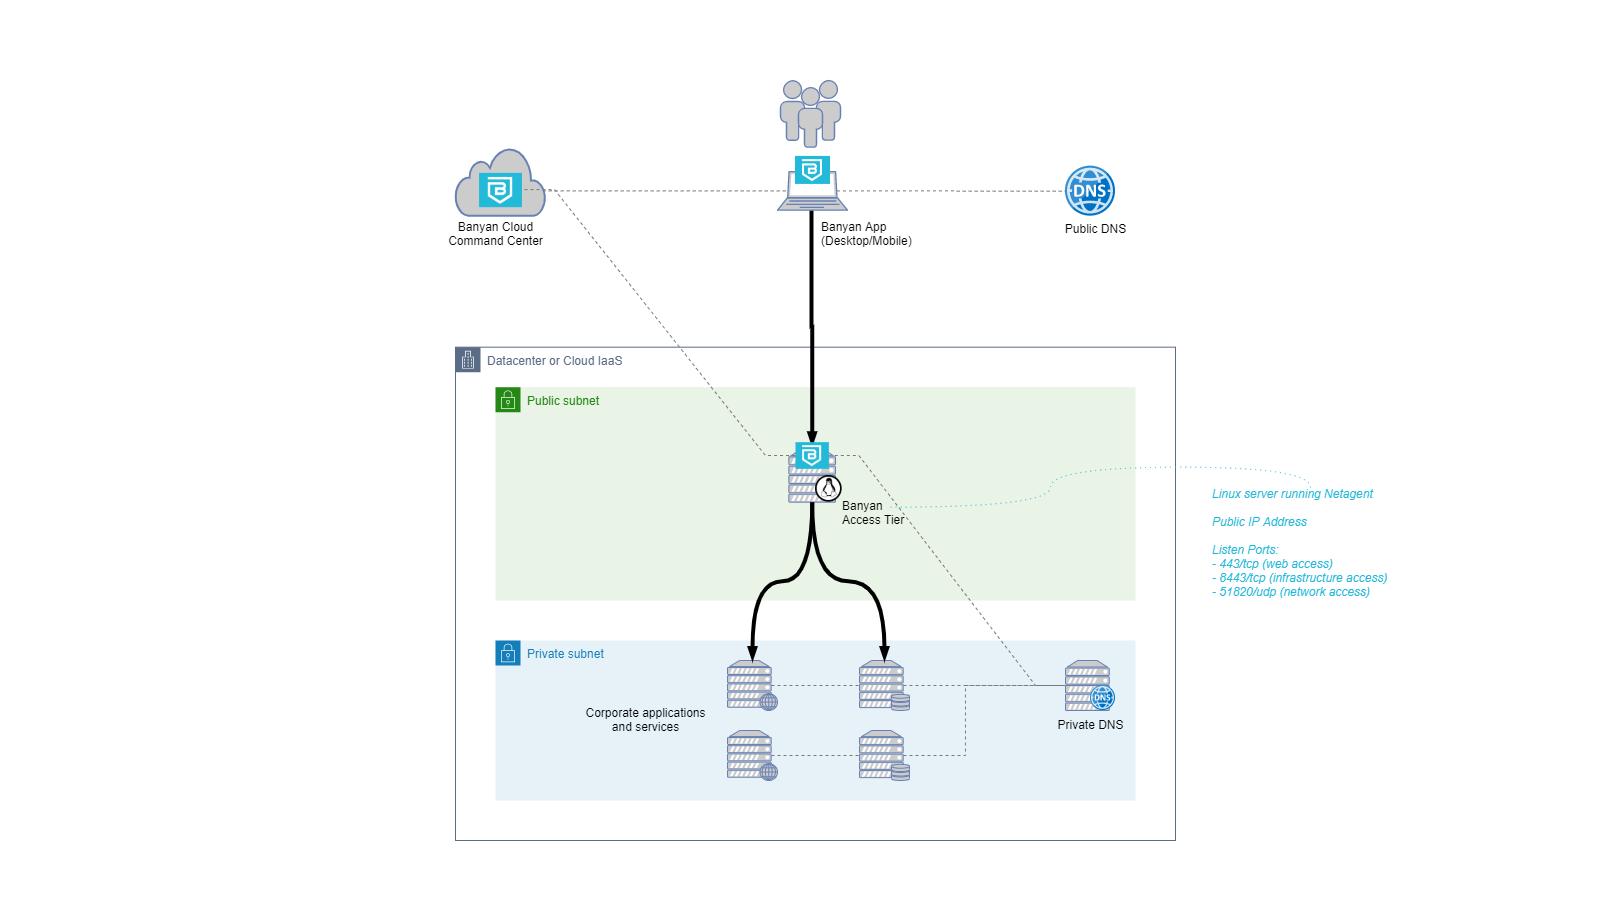
The diagram below depicts the traffic flow through an Access Tier. Most troubleshooting involves tracking the traffic through the different hops from source to destination.

The troubleshooting steps below assume you have defined a service with domain name servicename.corp.example.com on port 443 of the Access Tier. For your troubleshooting provide your specific service name. For infrastructure services, you should replace port 443 with 8443.
1. Ensure that your service domain name resolves to the IP address of the Access Tier
You can use the host command on Mac and Linux, or the equivalent nslookup command on Windows
enduser-device $> host servicename.corp.example.com
enduser-device $> nslookup servicename.corp.example.com
2. Check that you can establish a TCP connection to the Access Tier
enduser-device $> nc -v servicename.corp.example.com 443
3. Check that the service has been defined with the appropriate TLS certificate settings
enduser-device $> openssl s_client -connect servicename.corp.example.com:443 -servername servicename.corp.example.com
4. Ensure that the backend application is reachable from the Access Tier
The Access Tier must be able to send network packets to the backend application or service instances. You can verify this my SSH-ing into an Access Tier VM and connecting to the backend.
accesstier-host $>nc -v <backend-ip-or-name> <backend-port>
If you have been successful in running through steps 1-4 above and still have issues connecting to your service, please peruse the list of common issues below.
List of Common Issues and Debugging Tips
Installation
-
YAML syntax errors in
config.yaml. Make sure there is a space character after the colon:character, and quote string values to avoid type ambiguity. -
Unsupported fields in
config.yaml. For a given Netagent version, all of the supported configuration parameters are listed inconfig.yaml.tpl. -
Unsupported Linux distribution
-
Host firewall conflicts with
iptablesrules. Disable host firewallufwon CentOS. -
Kernel module failed to install. Output of
sudo modinfo /opt/banyan/netting.koshould showvermagicvalue that matches the currently booted kerneluname -r -
Kernel module download failed. You can manually download with
curl -O https://www.banyanops.com/netting/kms/latest/$(uname -r)/netting.gpg
Operation – Cloud Command Center console
-
Service not recognized. Check in service tab on access tier detail page. Info about rejected services is not displayed in the console but may be present in the API response visible through the web inspector.
-
Not seeing Access events. All Netagents report authorized and unauthorized connections and requests under
Monitor > Events > Filter By > Event Type > Access. Access events are rate limited by default from Netagents. To disable rate limiting, change the netagent parametersaccess_event_credits_limitingandaccess_event_key_limitingtofalse.
Operation – Network tools
-
Service name resolution failing. Ensure that
host service-domain-nameornslookup service-domain-nameresolves to the IP address of the Access Tier. -
TCP connection failing. Check TCP connectivity with netcat:
nc -v service-domain-name [8]443. -
TLS error. Check TLS server cert:
openssl s_client -connect service-domain-name:[8]443 -servername service-domain-name
Operation – On-host debugging
-
Traffic is not intercepted. Check the entries in
sudo ipset listfor the expected destination IP addresses and port numbers. -
Unexpected iptables rules: run
sudo iptables-saveto obtain the full list of rules. -
Other error. Debug logs are in
/var/log/banyandirectory. The most commonly used files arenetagent.logandctrl-netagent.log, and their rotations.